Introduction
Compared with biochemical experiments, high content analysis (HCA), which analyze phenomena occurring in cells based on microscopic images, allows to acquire wide-ranging data in a single experiment, including not only the amount of the target molecules but also the dynamics such as localization and the morphological information of cells as well as intracellular organelles.
In addition, the phenomena can be verified through actual images, and the non-specific phenomena that may result in false positives in traditional high throughput screening (HTS) can also be eliminated. Moreover, after acquiring images once, HCA allows to analyze them any number of times from various angles, which provides an efficient and multidimensional understanding of cell's physiological phenomena. Owing to this, the necessity for HCA in basic research and drug discovery is increasing.
On the other hand, experimental systems which reproduce the environments similar to that in vivo such as live-cell systems
using biomarkers and 3D culture, in order to capture phenomena occurring in the organism, have become complicated.
Furthermore, assays without cell labeling, which minimizes the effect on cells, have become popular in recent years especially in regenerative medicine. Thus the demand for the label-free analysis is increasing.
The CellPathfinder software, with the intuitive and easy-to-use interface, guides the user from analyzing thousands of image data in various angles to visualize the results by generating numerous graph types.
In addition, the Machine Learning and Deep Learning function increase the target recognition capability dramatically. It is also ideal for the analysis with the complexity and high-degree-of-difficulty such as analyzing the data from 3D culture and live-cell imaging.
Furthermore, the Machine Learning and the Deep Learning function are also highly usable for
analyzing bright field images. There it is covering a wide range of analysis steps of fluorescence as well as of bright field images.
The CellPathfinder software is a powerful tool that broadens the capability of HCA.
Features / strengths
Basic Analysis Function
- Load and execute analysis protocol: Easy-to-understand graphical icons
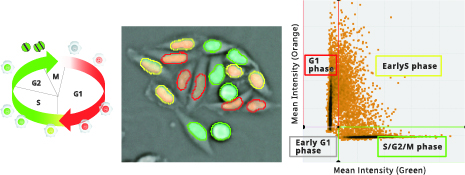
- Gating: Specific populations can be extracted by gating the feature value data of recognized objects
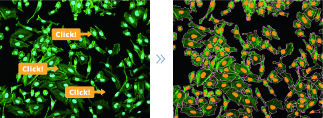
- Graph: To visualize the results, the link between graph and images enables quick visual check of images by clicking data points
- 3D analysis: Analysis of Z-stack images in three-dimensional space. The volume and the location of objects in 3D space can be quantified.
- Image Stitching: Tiled images are generated through image stitching and analyzed, allowing for accurate quantification. Ideal for analysis spanning across fields, such as of spheroids, tissue sections and neurites.
- Contrast-Enhanced Bright Field
Deep Learning Function
- You can recognize targeted objects, such as cells and intracellular organelles by painting them using not only fluorescence images but also bright field images.
- This function detects cells with simple operation of enclosing cells.
No expertise is required. It is possible to count cells in high-density on bright field images as well as flourescence images.
- You can classify phenotypes that are difficult to quantify but appear to be "something different". Simple operation of selecting the cell groups to be classified. No need to select effective features or set thresholds.
Specification in detail
Output data formats
Numeric data: CSV Image data: PNG, JPEG, TIFF Video data: Windows Media Video (WMV), MPEG4
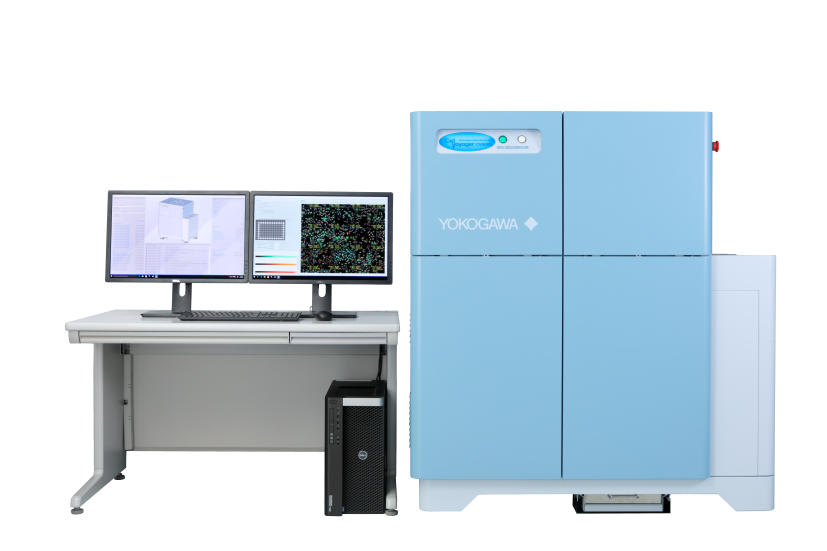
Compatible equipment
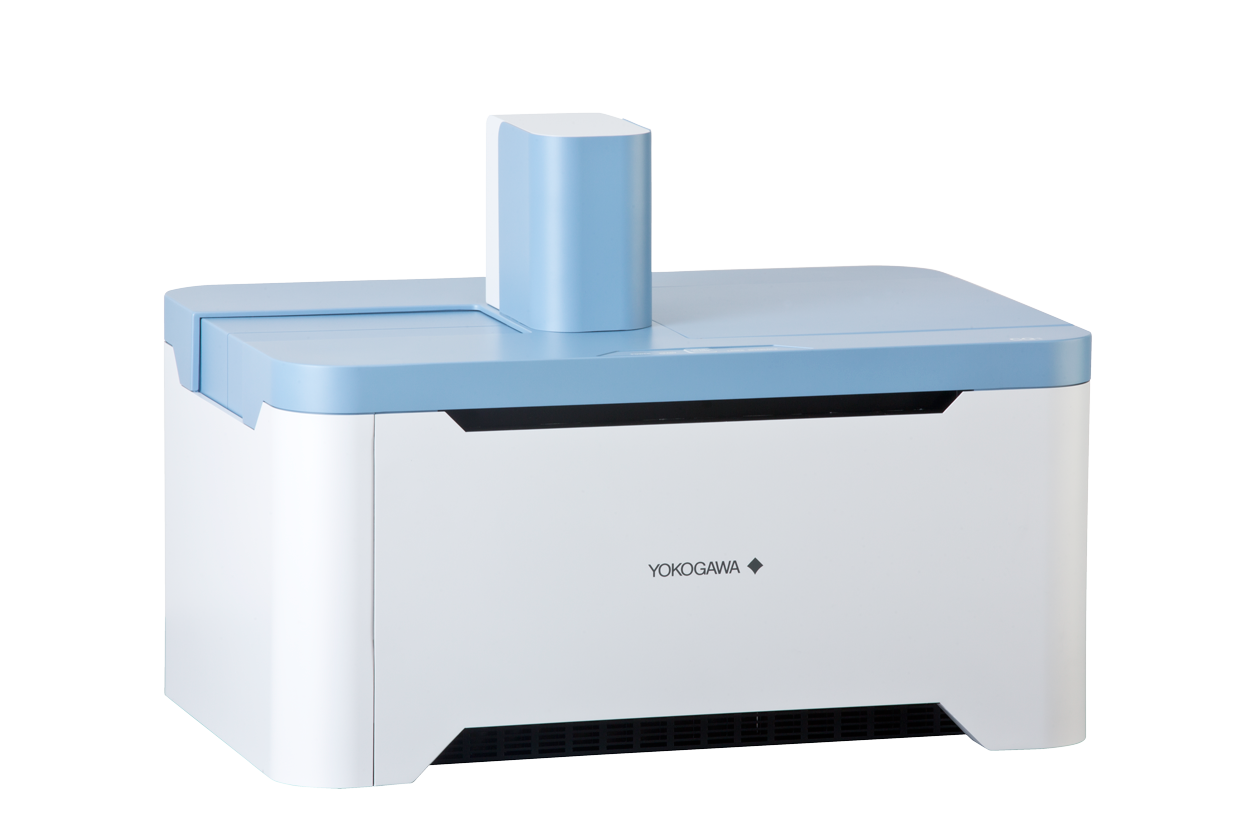
CellVoyager CV7000, CV8000, CQ1
Standard Workstation
Model: Dell Precision*2 CPU: Intel Xeon Memory: 128GB HDD: System drive (C:)4TB Data drive (D: )4TB OS: Microsoft Windows10 IoT Enterprise*5 64bit English GPU: Quadro P620 Interface: Mini DisplayPort×4(with Mini DisplayPort to DisplayPor adapter) Power Supply: 100 to 240VAC/ 50 or 60Hz, 950Wmax Chassis: W176.5mm×D518.3mm×H417.9mm Weight: 17kg
Workstaton with high-performance GPU
Model: Dell Precision*2 CPU: Intel Xeon Memory: 128GB HDD: System drive (C:)4TB Data drive (D: )4TB OS: Microsoft Windows10 IoT Enterprise*5 64bit English GPU: Quadro RTX5000 Interface: DisplayPort×4 Power Supply: 100 to 240VAC/ 50 or 60Hz, 950Wmax Chassis: W176.5mm×D518.3mm×H417.9mm Weight: 17kg
Supporting document